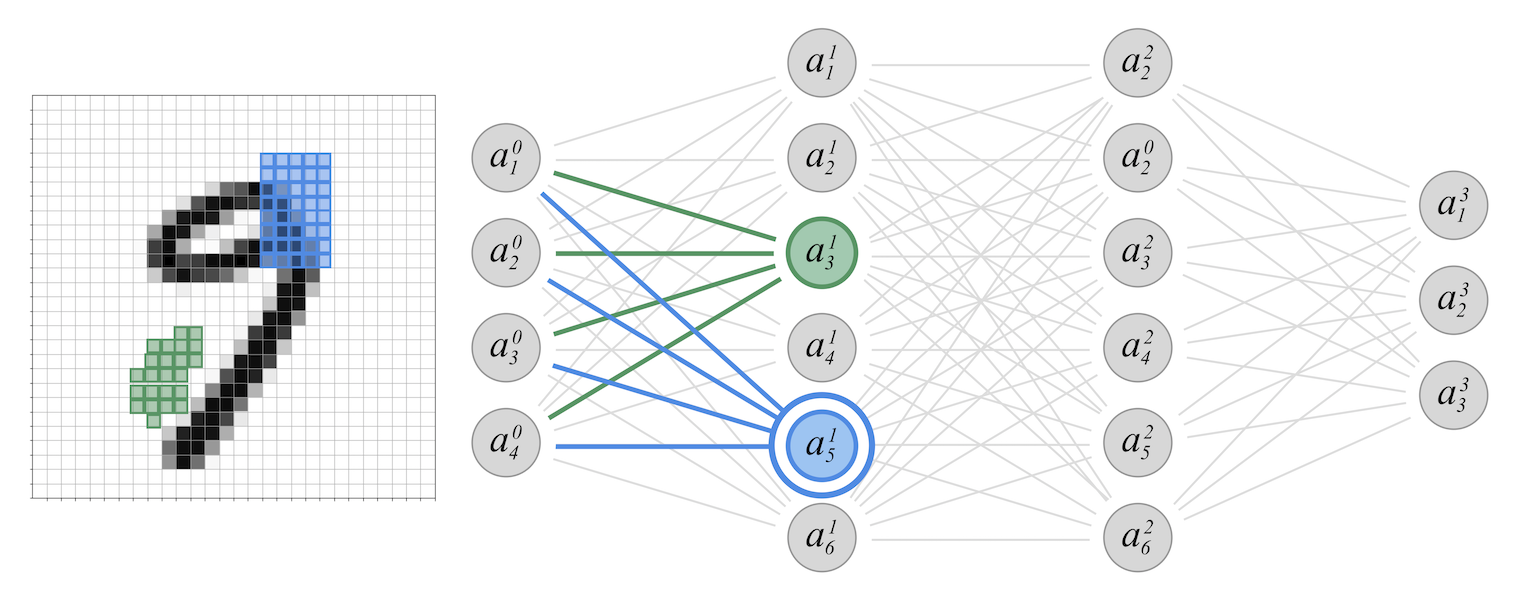
Simple Neural Network
29/10/2019

In this short tutorial, I show how to implement a simple neural network model able to classify hand-written digits. The implementation is based on the Keras framework and uses the MNIST open-source dataset of hand-written digits.
The Jupyter Notebook can be downloaded from here. You can also download the PDF slides of a lesson on the topic I taught at the University of St.Gallen in Switzerland.
Load Modules
import numpy  as np
import pandas  as pd
np.random.seed(2019)

%pylab inline
# For retina displays:
# %config InlineBackend.figure_format = 'retina'
This notebook requires the Keras module. You can install it with the shell command pip install keras.
from keras.models     import Sequential
from keras.layers     import Activation
from keras.optimizers import SGD
from keras.layers     import Dense
from keras.utils      import to_categorical
from keras.datasets   import mnist
from keras.metrics    import categorical_accuracy
from keras.callbacks  import EarlyStopping
The module seaborn is not necessary. Just for nicer plots, install it with pip install seaborn.
import seaborn as sns
sns.set(style='white', font_scale=1.3, rc={
    'lines.linewidth': 3,
    'axes.grid': True, 'grid.linestyle': ':',
    'axes.spines.left': True,
    'axes.spines.bottom': True,
    'axes.spines.right': True,
    'axes.spines.top': True,
    'axes.edgecolor': '.5',
})
Load MNIST Dataset
(x_trai, y_trai), (x_test, y_test) = mnist.load_data()
L_trai = len(x_trai)
L_test = len(x_test)

# Reshape the images into vectors of dim 28*28=784
X_trai = x_trai.reshape((L_trai, -1))
X_test = x_test.reshape((L_test, -1))

# Y needs to be converted into a vector with indicators
Y_test = to_categorical(y_test)
Y_trai = to_categorical(y_trai)

print("We have %d samples in the training set"%L_trai)
print("We have %d samples in the test set"%L_test)
We have 60000 samples in the training set
We have 10000 samples in the test set
Plot some random digits
NX, NY = 2, 6
fig, ax = plt.subplots(NX,NY,figsize=(1.5*NY,1.5*NX))
for i in range(NX):
    for j in range(NY):
        img = x_trai[np.random.randint(L_trai)]
        ax[i][j].imshow(img, cmap='Greys');
        ax[i][j].set_xticklabels([]); ax[i][j].set_xticks([])
        ax[i][j].set_yticklabels([]); ax[i][j].set_yticks([])
plt.tight_layout()
#plt.savefig("digits_examples.pdf")

Shallow Neural Network
Only one hidden layer
# Define the shallow neural network

stop_rule = EarlyStopping(monitor='val_loss', patience=5, verbose=1, mode='auto')

model = Sequential()
model.add(Dense(300, input_dim=784, activation="relu"))
model.add(Dense(10))              # 10 is the output dimension
model.add(Activation("softmax"))  # Provides a probabilities for each of 0,..,9
model.compile(loss="categorical_crossentropy", optimizer=SGD(), metrics=[categorical_accuracy] )
history = model.fit(
    X_trai, Y_trai, validation_split=0.2,
    epochs=30, batch_size=512, verbose=1,
    callbacks=[stop_rule],
)
df = pd.DataFrame(history.history).rename({
    'loss':'Training Loss', 'val_loss':'Validation Loss'
},axis=1)

fig, ax1 = plt.subplots(1,1, figsize=(10,5))
df.iloc[1:][['Training Loss', 'Validation Loss']].plot(style='-o', ax=ax1, logy=True);

Out-of-sample predictions
preds = model.predict(X_test)
# The predicted class is the one with the highest prob
preds = np.argmax(preds,axis=1)
reals = np.argmax(Y_test,axis=1)

accuracy_in  = df.iloc[-1]['categorical_accuracy']
accuracy_out = np.mean(preds==reals)
print("In-sample accuracy:     {0:0.2f}% ".format(accuracy_in*100))
print("Out-of-sample accuracy: {0:0.2f}%".format(accuracy_out*100))
In-sample accuracy:     88.45%
Out-of-sample accuracy: 86.96%
NX, NY = 2, 6
fig, ax = plt.subplots(NX,NY,figsize=(1.5*NY,2*NX))
for i in range(NX):
    for j in range(NY):
        s = np.random.randint(len(preds))
        img = x_test[s]
        colors = 'Greens' if reals[s]==preds[s] else 'Reds'
        ax[i][j].imshow(img, cmap=colors)
        ax[i][j].set_title("Number:    %d \nPredicted: %d"%(reals[s], preds[s]))
        ax[i][j].set_xticklabels([]); ax[i][j].set_xticks([])
        ax[i][j].set_yticklabels([]); ax[i][j].set_yticks([])
plt.tight_layout()

Go Deeper
4 hidden layers
stop_rule = EarlyStopping(monitor='val_loss', patience=5, verbose=1, mode='auto')

# Define the neural network
deep_model = Sequential()
deep_model.add(Dense(300, input_dim=784, activation="relu"))
deep_model.add(Dense(150, activation="relu"))
deep_model.add(Dense(100, activation="relu"))
deep_model.add(Dense(50 , activation="relu"))
deep_model.add(Dense(10))              # 10 is the output dimension
deep_model.add(Activation("softmax"))  # Provides a probabilities for each of 0,..,9
deep_model.compile(loss="categorical_crossentropy", optimizer=SGD(), metrics=[categorical_accuracy] )

history = deep_model.fit(
    X_trai, Y_trai, validation_split=0.2,
    epochs=30, batch_size=512, verbose=1,
    callbacks=[stop_rule],
)
df = pd.DataFrame(history.history).rename({
    'loss':'Training Loss', 'val_loss':'Validation Loss'
},axis=1)
df.index = df.index + 1
fig, ax1 = plt.subplots(1,1, figsize=(10,5))
df[['Training Loss', 'Validation Loss']].plot(style='-o', ax=ax1, logy=True);

Out-of-sample predictions
preds = deep_model.predict(X_test)
# The predicted class is the one with the highest prob
preds = np.argmax(preds,axis=1)
reals = np.argmax(Y_test,axis=1)

accuracy_in  = df.iloc[-1]['categorical_accuracy']
accuracy_out = np.mean(preds==reals)
print("In-sample accuracy:     {0:0.2f}% ".format(accuracy_in*100))
print("Out-of-sample accuracy: {0:0.2f}%".format(accuracy_out*100))
In-sample accuracy:     99.58%
Out-of-sample accuracy: 94.51%
NX, NY = 2, 6
fig, ax = plt.subplots(NX,NY,figsize=(1.5*NY,2*NX))
for i in range(NX):
    for j in range(NY):
        s = np.random.randint(len(preds))
        img = x_test[s]
        colors = 'Greens' if reals[s]==preds[s] else 'Reds'
        ax[i][j].imshow(img, cmap=colors)
        ax[i][j].set_title("Number:    %d \nPredicted: %d"%(reals[s], preds[s]))
        ax[i][j].set_xticklabels([]); ax[i][j].set_xticks([])
        ax[i][j].set_yticklabels([]); ax[i][j].set_yticks([])
plt.tight_layout()

Author: Andrea Barbon
Back

